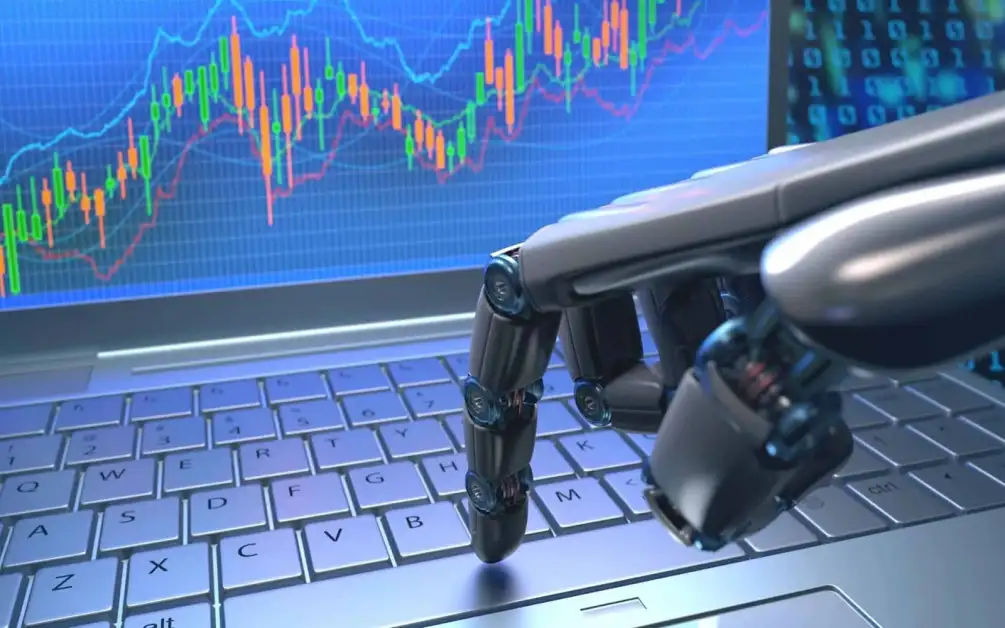
Advantages of AI trading software
One of the most important things to consider when choosing trading software is its accuracy. The AI approach to trading enables it to quickly identify patterns and trends in financial data, which makes it far more accurate than even the best human trader. Some of the core advantages of AI...